LOKI官方文档
python使用数据推送(没用)
# example of usage grafana/loki api when you need push any log/message from your python scipt
import requests
import json
import datetime
import pytz

host = 'somehost'
curr_datetime = datetime.datetime.now(pytz.timezone('Asia/Yekaterinburg'))
curr_datetime = curr_datetime.isoformat('T')
msg = 'On server {host} detected error'.format(host=host)

# push msg log into grafana-loki
url = 'http://host-where-loki-run:3100/loki/api/v1/push '
headers = {
    'Content-type': 'application/json'
}
payload = {
    'streams': [
        {
            'labels': '{source=\"Name-of-your-source\",job=\"name-of-your-job\", host=\"' + host + '\"}',
            'entries': [
                {
                    'ts': curr_datetime,
                    'line': '[WARN] ' + msg
                }
            ]
        }
    ]
}
payload = json.dumps(payload)
answer = requests.post(url, data=payload, headers=headers)
print(answer)
response = answer
print(response)
# end pushing
使用docker compose部署
docker-compose.yml
version: "3"

networks:
  loki:

services:
  loki:
    image: grafana/loki
    ports:
      - "3100:3100"
      - "9096:9096"
    command: -config.file=/etc/loki/loki-config.yaml
    environment:
      - TZ=Asia/Shanghai
    volumes:
      - ./loki-config.yaml:/etc/loki/loki-config.yaml
    networks:
      - loki

  promtail:
    image: grafana/promtail
    environment:
      - TZ=Asia/Shanghai
    volumes:
      - ./promtail-config.yaml:/etc/promtail/promtail-config.yaml
      - /var/lib/docker/containers:/var/log
    ports:
      - "9080:9080"
    command: -config.file=/etc/promtail/promtail-config.yaml
    networks:
      - loki

  grafana:
    image: grafana/grafana:master
    environment:
      - TZ=Asia/Shanghai
    ports:
      - "3000:3000"
    networks:
      - loki
loki-config.yaml
auth_enabled: false

server:
  http_listen_port: 3100
  grpc_listen_port: 9096

common:
  instance_addr: 47.120.55.99
  path_prefix: /tmp/loki
  storage:
    filesystem:
      chunks_directory: /tmp/loki/chunks
      rules_directory: /tmp/loki/rules
  replication_factor: 1
  ring:
    kvstore:
      store: inmemory

query_range:
  results_cache:
    cache:
      embedded_cache:
        enabled: true
        max_size_mb: 100

schema_config:
  configs:
    - from: 2020-10-24
      store: boltdb-shipper
      object_store: filesystem
      schema: v11
      index:
        prefix: index_
        period: 24h

limits_config:
  reject_old_samples: false

ruler:
  alertmanager_url: http://localhost:9093

# By default, Loki will send anonymous, but uniquely-identifiable usage and configuration
# analytics to Grafana Labs. These statistics are sent to https://stats.grafana.org/
#
# Statistics help us better understand how Loki is used, and they show us performance
# levels for most users. This helps us prioritize features and documentation.
# For more information on what's sent, look at
# https://github.com/grafana/loki/blob/main/pkg/usagestats/stats.go
# Refer to the buildReport method to see what goes into a report.
#
# If you would like to disable reporting, uncomment the following lines:
#analytics:
#  reporting_enabled: false
promtail-config.yaml
server:
  http_listen_port: 9080
  grpc_listen_port: 0

positions:
  filename: /tmp/positions.yaml

clients:
  - url: http://47.120.55.99:3100/loki/api/v1/push

scrape_configs:
 - job_name: master
   pipeline_stages:
   static_configs:
   - targets:
      - localhost
     labels:
      job: mysqlmaster
      __path__: /var/log/979a50cd407f04afb615d57fce227e10bcad7649206844b4dc9a071ee8076fc6/*.log
 - job_name: slave
   pipeline_stages:
   static_configs:
   - targets:
      - localhost
     labels:
      job: mysqlslave
      __path__: /var/log/af47acfc3015e8e2973c6becd3122cb6c2d57bcb11a63f8b641b25d3585c7cc8/*.log
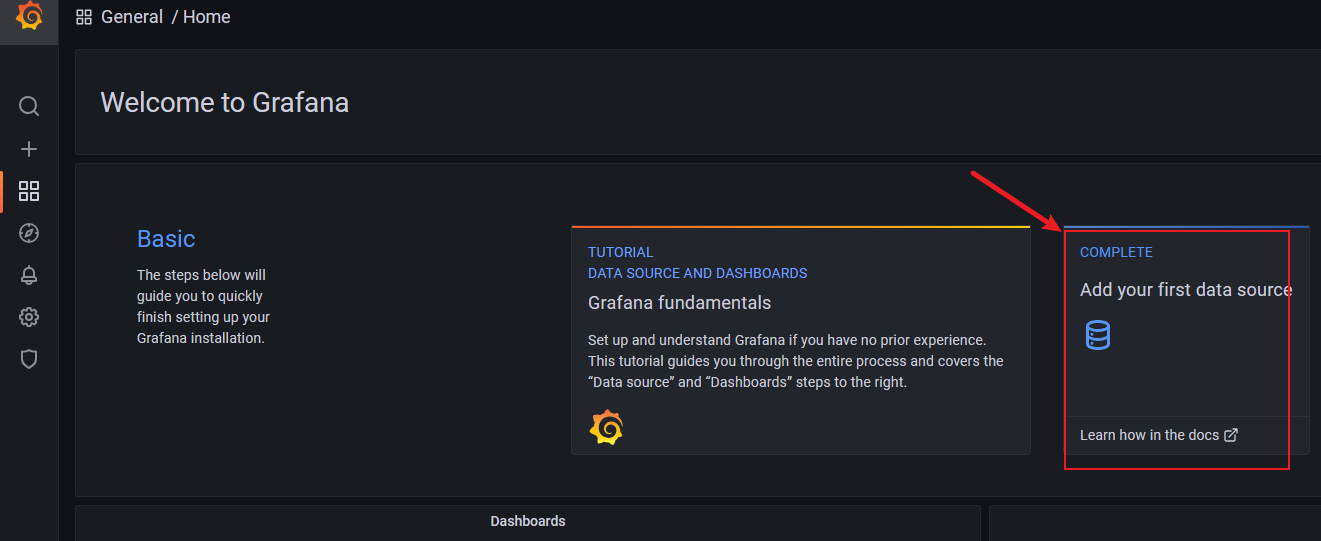
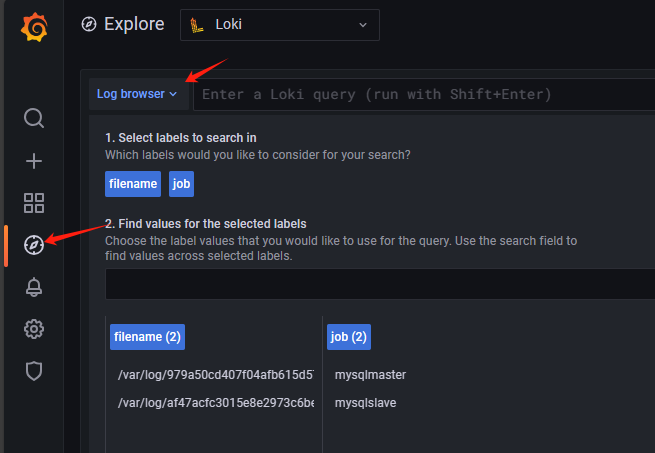
打开3000端口: 用户名admin, 密码admin